


Which States Have the Most Neighborhood Watch Programs?
Community watch programs have their roots in America’s colonial days. The Town Watch was a way for neighbors to alert the authorities—often a lone night guard—about suspicious activities in their village. Over time, the concept has grown and adapted into the modern neighborhood crime watch. The idea is simple: communities look out for one another by keeping an eye open for potential criminal acts and reporting them to the local police.
But how many communities actually have organized Neighborhood Watch Programs? VivintSource.com Analysts put their heads together to discover which states have the most Watch Programs per capita. Here’s what we found.


Interesting Facts about Neighborhood Watch Programs
- The first official Neighborhood Watch Program was created in 1972 by the National Sheriffs Association in response to the rising crime rates of the late 1960s.
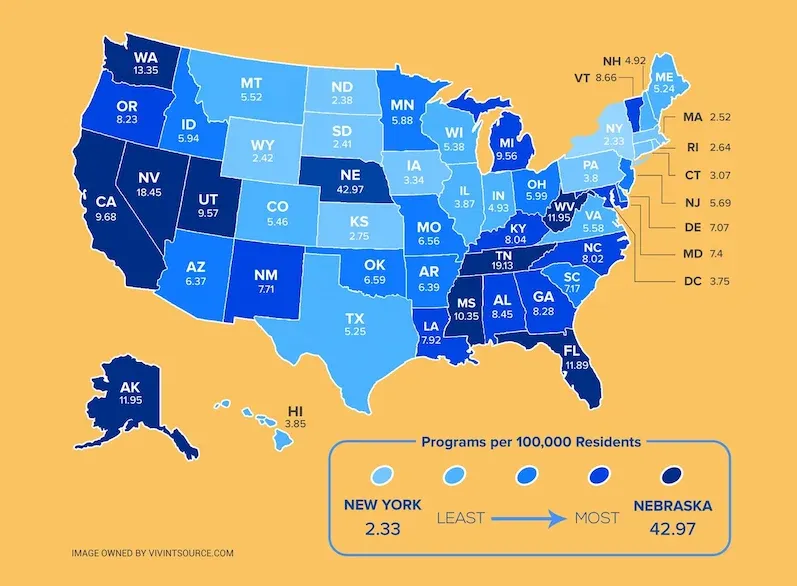
- California has the most overall programs, with 3,828. Because of the high population (around thirty-nine million people), this comes out to an average of 9.68 programs per 100,000 people.
- Nebraska, with 825 recognized programs, has the highest average number of programs per 100,000 people: 42.97. This is more than double the number in Tennessee, which is the state with the next highest average number of programs per 100,000 people: 19.13.
- Lincoln, Nebraska, started the first Neighborhood Watch in 1981. The city expanded the program using Nextdoor, a community-specific website, and Lincoln now has 22,000 participants.
- Only four states—California, Florida, Tennessee, and Texas—have more than 1,000 total programs.
- New York has the lowest average number of programs per 100,000. The state’s total 462 watches create an average of 2.33 programs per 100,000 people.
Neighborhood Watch Programs as Effective Crime Deterrents
Though there seems to be a significant gap between the states with the highest and lowest average number of programs—Nebraska and New York respectively—these numbers don’t always correlate with community safety. A deeper look at the numbers exposes the efficacy of Neighborhood Watch Programs:
- A 2008 study by the US Department of Justice found a 16% decrease in crime in Neighborhood Watch areas compared to their controls.
- Eight of the ten states with the most Neighborhood Watch Programs per capita had more crime per capita in 2017 than the average state.
- Even though New York has the fewest Watch Programs per capita, it has some of the lowest burglary rates, only 176.3 burglaries per 100,000 residents in 2017.
Neighborhood Watches—Just One Part of the Puzzle
As part of the overall solution to lower crime, Neighborhood Watch Programs are only as productive as the attentiveness of their communities. The good news is that the modern Town Watch is evolving. Apps like Vivint Streety combine a network of security cameras throughout a community and shares the footage in real-time to all users who participate. Community variables such as police presence, the number of homes with reliable and comprehensive security systems, and the close-knit aspects of a neighborhood also play a part in crime reduction.
Rank | State | Total Watch Programs | Population | Programs per 100,000 Residents |
|---|---|---|---|---|
1 | Nebraska | 825 | 1,920,076 | 42.97 |
2 | Tennessee | 1285 | 6,715,984 | 19.13 |
3 | Nevada | 553 | 2,998,039 | 18.45 |
4 | Washington | 989 | 7,405,743 | 13.35 |
5 | West Virginia | 217 | 1,815,857 | 11.95 |
6 | Florida | 2495 | 20,984,400 | 11.89 |
7 | Alaska | 85 | 739,795 | 11.49 |
8 | Mississippi | 309 | 2,984,100 | 10.35 |
9 | California | 3828 | 39,536,653 | 9.68 |
10 | Utah | 297 | 3,101,833 | 9.57 |
11 | Michigan | 952 | 9,962,311 | 9.56 |
12 | Vermont | 54 | 623,657 | 8.66 |
13 | Alabama | 412 | 4,874,747 | 8.45 |
14 | Georgia | 864 | 10,429,379 | 8.28 |
15 | Oregon | 341 | 4,142,776 | 8.23 |
16 | Kentucky | 358 | 4,454,189 | 8.04 |
17 | North Carolina | 824 | 10,273,419 | 8.02 |
18 | Louisiana | 371 | 4,684,333 | 7.92 |
19 | New Mexico | 161 | 2,088,070 | 7.71 |
20 | Maryland | 448 | 6,052,177 | 7.40 |
21 | South Carolina | 360 | 5,024,369 | 7.17 |
22 | Delaware | 68 | 961,939 | 7.07 |
23 | Oklahoma | 259 | 3,930,864 | 6.59 |
24 | Missouri | 401 | 6,113,532 | 6.56 |
25 | Arkansas | 192 | 3,004,279 | 6.39 |
26 | Arizona | 447 | 7,016,270 | 6.37 |
27 | Ohio | 698 | 11,658,609 | 5.99 |
28 | Idaho | 102 | 1,716,943 | 5.94 |
29 | Minnesota | 328 | 5,576,606 | 5.88 |
30 | New Jersey | 512 | 9,005,644 | 5.69 |
31 | Virginia | 473 | 8,470,020 | 5.58 |
32 | Montana | 58 | 1,050,493 | 5.52 |
33 | Colorado | 306 | 5,607,154 | 5.46 |
34 | Wisconsin | 312 | 5,795,483 | 5.38 |
35 | Texas | 1487 | 28,304,596 | 5.25 |
36 | Maine | 70 | 1,335,907 | 5.24 |
37 | Indiana | 329 | 6,666,818 | 4.93 |
38 | New Hampshire | 66 | 1,342,795 | 4.92 |
39 | Illinois | 496 | 12,802,023 | 3.87 |
40 | Hawaii | 55 | 1,427,538 | 3.85 |
41 | Pennsylvania | 487 | 12,805,537 | 3.80 |
42 | District of Columbia | 26 | 693,972 | 3.75 |
43 | Iowa | 105 | 3,145,711 | 3.34 |
44 | Connecticut | 110 | 3,588,184 | 3.07 |
45 | Kansas | 80 | 2,913,123 | 2.75 |
46 | Rhode Island | 28 | 1,059,639 | 2.64 |
47 | Massachusetts | 173 | 6,859,819 | 2.52 |
48 | Wyoming | 14 | 579,315 | 2.42 |
49 | South Dakota | 21 | 869,666 | 2.41 |
50 | North Dakota | 18 | 755,393 | 2.38 |
51 | New York | 462 | 19,849,399 | 2.33 |
Methodology
We gathered the listings of all 28,238 Neighborhood Watch Programs listed on nnw.org. Any programs that were duplicates of each other, not in the US, or missing addresses or states were removed. This left us with 24,212 programs. We ranked each state and the District of Columbia on how many registered watch programs they had per 100,000 residents.