Six months ago, the team at Clearlink, an authorized retailer of Vivint smart home security that powers VivintSource.com, helped debunk the myth that winter brings thieves out of the woodwork. It’s actually summer thieves that are the busiest of all.
The reasons aren’t clear, but the professor we cited previously guesses that theft spikes when large numbers of people are out of the house at once. Late October, for example—near Halloween—is the most likely time for theft during autumn.
The biggest spike in summer theft happens in June. Warm weather draws people outside, kids and teens have more unstructured free time, and many families travel and leave their homes empty.
Summer is clearly one of the most important times of year to practice good security hygiene. Lock up thoroughly, put your mail on hold, and add any extra security features that would make you feel safer.
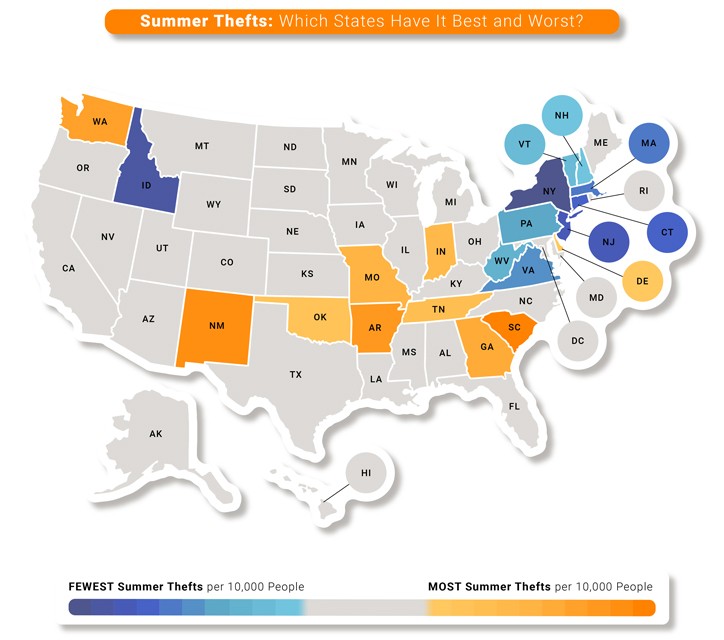
Below, check out the states with the highest and lowest summer theft rates. And if you’re feeling brave, try jumping into the same database we used (see Methodology) for stats from your own county, city, or state.
METHODOLOGY
How we identified the states with the most and least summer theft
- We gathered state totals on thefts committed in the months of June, July, and August from the years 2012 to 2016. We chose a five-year window to give a time-tested glance at each state, and we pulled these specific years because they comprise the latest five-year period with available data from the FBI’s National Incident-Based Reporting System (NIBRS).
- We calculated thefts per capita and thefts per 10,000 residents using the populations each jurisdiction reported from 2012 to 2016.
- Finally, we ranked 48 states (see “Important Considerations” below for more details) by thefts per 10,000 residents and reported the 10 states with the highest and lowest records.
How we’re defining theft
Per the FBI, three types of property crime and one type of violent crime constitute theft:
- Larceny is theft or attempted theft without entering a home or threatening someone (stealing packages or parked bikes is a good example).
- Burglary is unlawfully entering a residence or building to steal property or commit another crime.
- Auto theft is stealing cars, boats, or other motor vehicles.
- Robbery is stealing from a victim using threatened or actual violence.
DATA HIGHLIGHTS
- Compared to winter, summer months average about 1,400 more monthly larcenies and 100 more monthly auto thefts per state.
- On average, burglary and robbery trends in summer and winter don’t vary significantly.
- Larceny is the most common crime of the four we considered, with an average of 9,163 monthly instances per state during summer.
- Robbery is the least common crime of the four we considered, with an average of 82 monthly instances per state during summer.
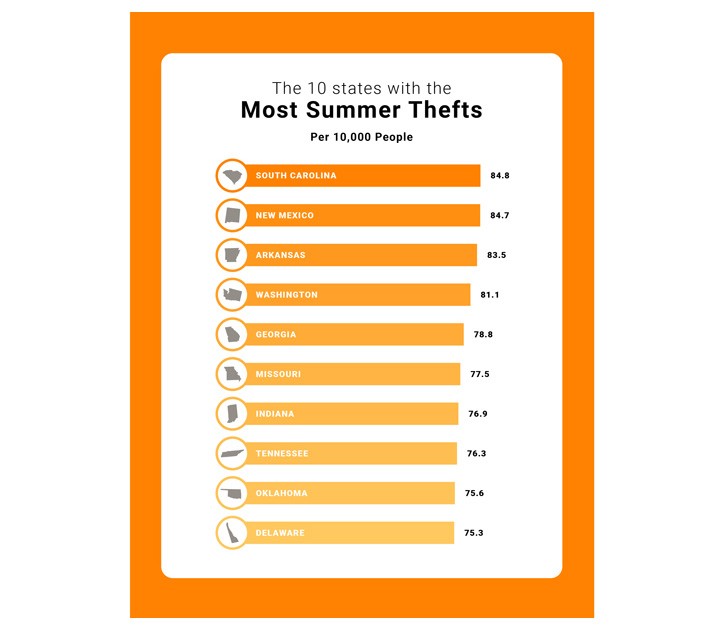
- South Carolina ranked highest for summer theft rates with about 85 violations per 10,000 residents. The state also falls within the top 10 for all four types of crime we tallied.
- California has the most auto thefts per capita during summer—on average, residents have 41,578 cars stolen during June, July, and August.
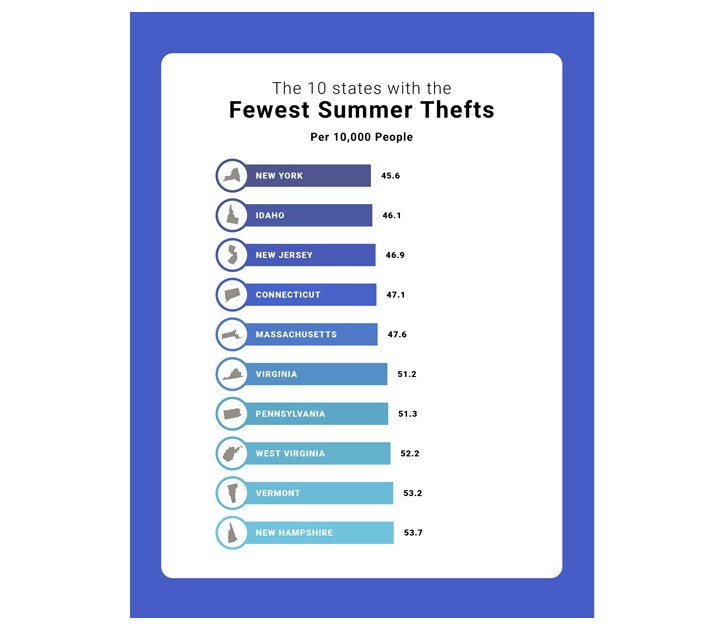
- New York’s summer theft rates rise moderately from its winter rates in all but one category: burglary. For that crime, New York keeps the #1 spot for the lowest rate in the country.
IMPORTANT CONSIDERATIONS
- Local and state law enforcement agencies aren’t required to submit reports to the NIBRS, so the above data represents only those that have reported.
- Due to data reporting issues, Illinois and Florida were left out of this report and our reporting was limited to 48 states.
RESULTS
Reporters can email questions to media@vivintsource.com.
VivintSource.com is powered by Clearlink Technologies, LLC, an authorized affiliate and retailer of Vivint Smart Home products and services.
REFERENCES
United States. Federal Bureau of Investigation. Uniform Crime Reporting Program Data: Property Stolen and Recovered, United States, 2016. Ann Arbor, MI: Inter-university Consortium for Political and Social Research [distributor], 2018-07-19. https://www.icpsr.umich.edu/web/NACJD/studies/37063/versions/V1
United States Department of Justice. Federal Bureau of Investigation. Uniform Crime Reporting Program Data: Property Stolen and Recovered, 2015. Ann Arbor, MI: Inter-university Consortium for Political and Social Research [distributor], 2017-05-05. https://www.icpsr.umich.edu/web/NACJD/studies/36792/versions/V1
United States Department of Justice. Federal Bureau of Investigation. Uniform Crime Reporting Program Data: Property Stolen and Recovered, 2014. Ann Arbor, MI: Inter-university Consortium for Political and Social Research [distributor], 2016-04-06. https://www.icpsr.umich.edu/web/NACJD/studies/36792/versions/V1
United States Department of Justice. Federal Bureau of Investigation. Uniform Crime Reporting Program Data: Property Stolen and Recovered, 2013. Ann Arbor, MI: Inter-university Consortium for Political and Social Research [distributor], 2015-08-04. https://www.icpsr.umich.edu/web/NACJD/studies/36792/versions/V1
United States Department of Justice. Federal Bureau of Investigation. Uniform Crime Reporting Program Data: Property Stolen and Recovered, 2012. Ann Arbor, MI: Inter-university Consortium for Political and Social Research [distributor], 2014-05-27. https://www.icpsr.umich.edu/web/NACJD/studies/36792/versions/V1